In this blog, I would like to briefly describe how easy is to build reports using ABAP CDS views in SAP.
As you may already know, there are various reporting tools such as BusinessObjects, Lumira, Fiori, Analysis for Microsoft Excel, BEx Analyser/Designer, Design Studio, etc. available in SAP. ABAP CDS View data can be consumed from one of the tools above to generate reports.
Let us look at the basics of CDS views. There are 3 types of ABAP CDS views available in SAP and they are basic views, composite views and consumption views.
Note: ABAP CDS views are similar to Hana Views (attribute views, analytic views and calculation views) but they are database independent and lie on the Application layer. On the other hand, Hana views are specific to Hana database and lie on the database layer.
Here are few examples of Basic Views, Basic view with data category DIMENSION below contains the select statement,
Basic view with data category #CUBE below contains the associations,
Once the basic views are defined, we should create a composite view.
Here is a simple CDS view with view type #COMPOSITE and data category #CUBE
When activating the composite CDS View, it creates a transient provider with the naming convention 2C
In this case, 2CZVGLDOCS1
Now we have the composite view ready. The following is a simple Consumption view with the annotation @Analytics.query
On activation, this would create a transient query with the naming convention 2C
In this case, 2CZCACCDOC
Now we have the CDS views ready. We should be able to test the analytic query (consumption view) via Query Monitor (transaction code – RSRT)
Consuming CDS view data from Fiori
CDS Data can be consumed from Fiori. We should expose the CDS view as a service using the OData protocol so that SAPUI5 application can consume the CDS data.
KPI design tools can be used to create Analytic Fiori tiles.
The annotation @OData.publish: true is used to publish odata service out of CDS views
OData Service with a naming conversion _CDS will be created automatically. In this case, Z_C_ACCOUNTINGDOCUMENTS_CDS
Note: Odata will be created but we should register the service manually via transaction /IWFND/MAINT_SERVICE
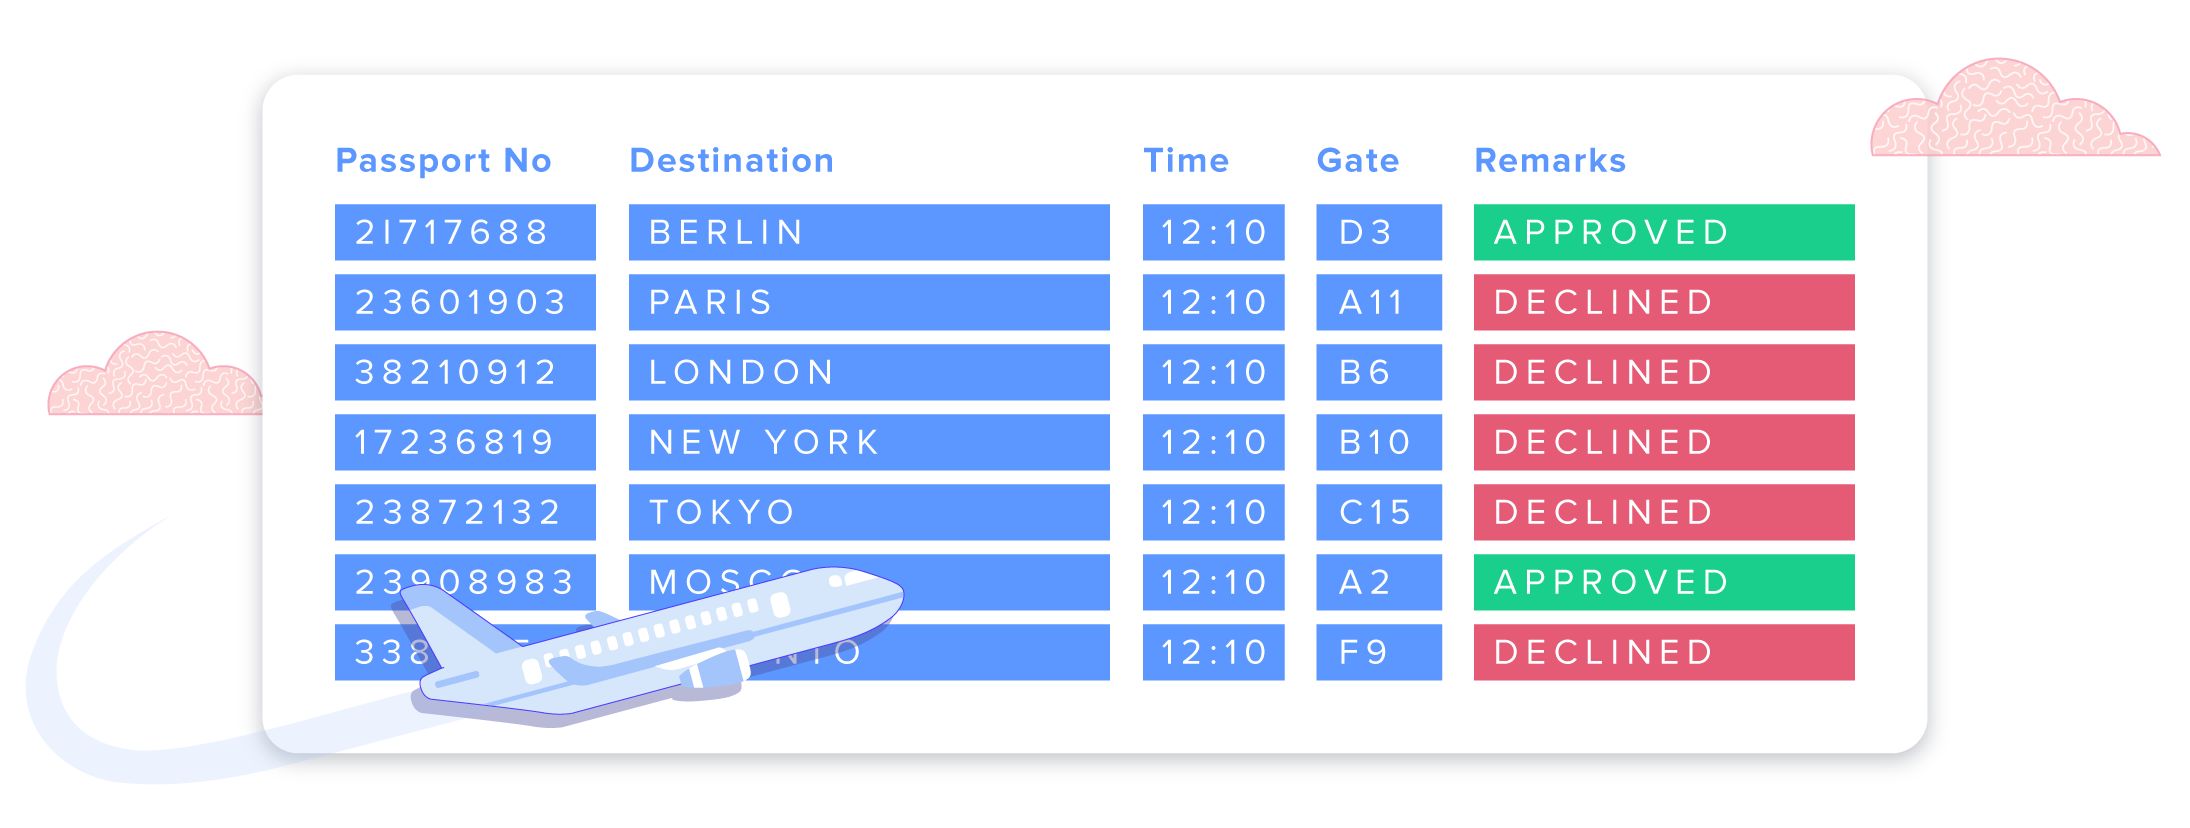
The following report is created using KPI design tools and the Odata service above
Several report/chart options available in Fiori,
Data in table format. Filters can be applied to create custom reports, which can be exported to excel from Fiori
Users should be able to drill down and apply filters.
Consuming CDS Views via Query Browser/Design Studio
Analytic CDS Views will be visible in Query Browser. Developers and business users should be able to use the Fiori tile to test CDS views and generate reports
Analytic consumption views will be visible in Query Browser,
Design studio is a built-in component in Query Browser
Users should be able to use this, slice and dice and generate reports
Consuming CDS View data from Analysis for Microsoft Excel
This excel based tool can be used to generate reports. Super users should be able to slice and dice with characteristics and key figures and save templates (workbooks) for the end users to run the reports. Report refreshes every time you opens the workbooks.
"Refresh All" button can be used to get the most updated data.
Note: Hierarchies can also be built using CDS views (the above screen shot shows a report with G/L account hierarchy)
BEx Analyser and Designer tools are quite old. Transient queries that are generated from CDS Views can be exposed to BEx Analyser/Designer and generate reports.
I have not tested these with BusinessObjects or Lumira. Any input on these are appreciated.
Please share your thoughts and opinion.
Hope this helps.
ABAP CDS Views have its own authorization concept based on a DCL. Wonder how Data Control Language (DCL) works with ABAP Core Data Services (CDS)?
,物联网水表,大数据下,双线服务器租用,大数据+,云主机